profiler
TIP
Generate a flame graph using async-profiler
The profiler command supports generating flame graph for application hotspots.
The basic usage of the profiler command is profiler action [actionArg]
The arguments of profiler command basically keeps consistent with upstream project async-profiler, you can refer to its README, Github Discussions and other documentations for further information of usage.
Supported Options
| Name | Specification |
|---|---|
| action | Action to execute |
| actionArg | Attribute name pattern |
| [i:] | sampling interval in ns (default: 10'000'000, i.e. 10 ms) |
| [f:] | dump output to specified directory |
| [d:] | run profiling for specified seconds |
| [e:] | which event to trace (cpu, alloc, lock, cache-misses etc.), default value is cpu |
Start profiler
$ profiler start
Started [cpu] profiling
TIP
By default, the sample event is cpu. Other valid profiling modes can be specified with the --event parameter, see relevant contents below.
Get the number of samples collected
$ profiler getSamples
23
View profiling status
$ profiler status
[cpu] profiling is running for 4 seconds
Can view which event and sampling time.
View profiler memory usage
$ profiler meminfo
Call trace storage:   10244 KB
      Dictionaries:      72 KB
        Code cache:   12890 KB
------------------------------
             Total:   23206 KB
Stop profiler
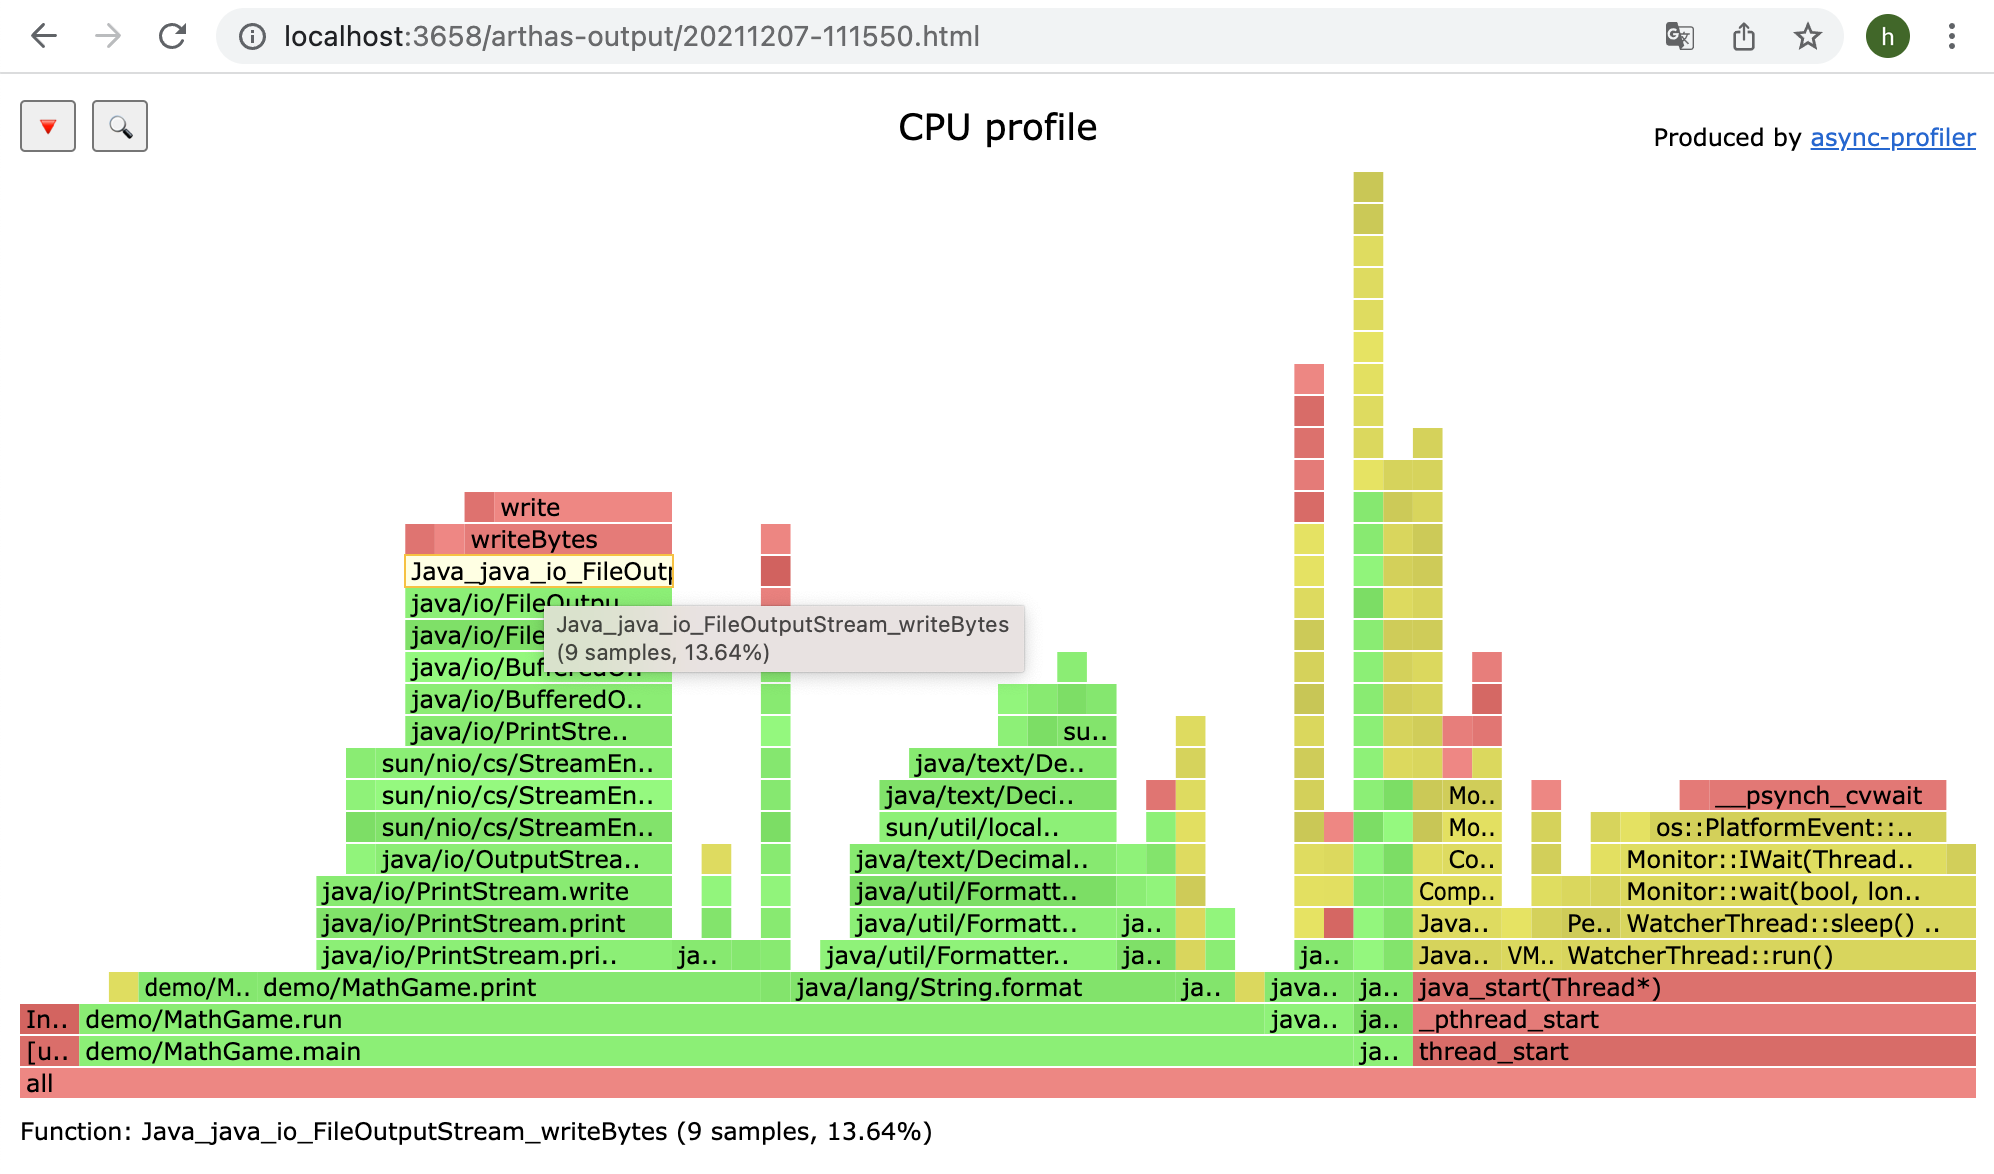
Generating flame graph results
By default, the result file is html file in Flame Graph format. You can also specify other format with the -o or --format parameter, including flat, traces, collapsed, flamegraph, tree, jfr:
$ profiler stop --format flamegraph
profiler output file: /tmp/test/arthas-output/20211207-111550.html
OK
When extension of filename in --file parameter is html or jfr, the output format can be infered. For example, --file /tmp/result.html will generate flamegraph automatically.
View profiler results under arthas-output via browser
By default, arthas uses port 3658, which can be opened: http://localhost:3658/arthas-output/ View the arthas-output directory below Profiler results:
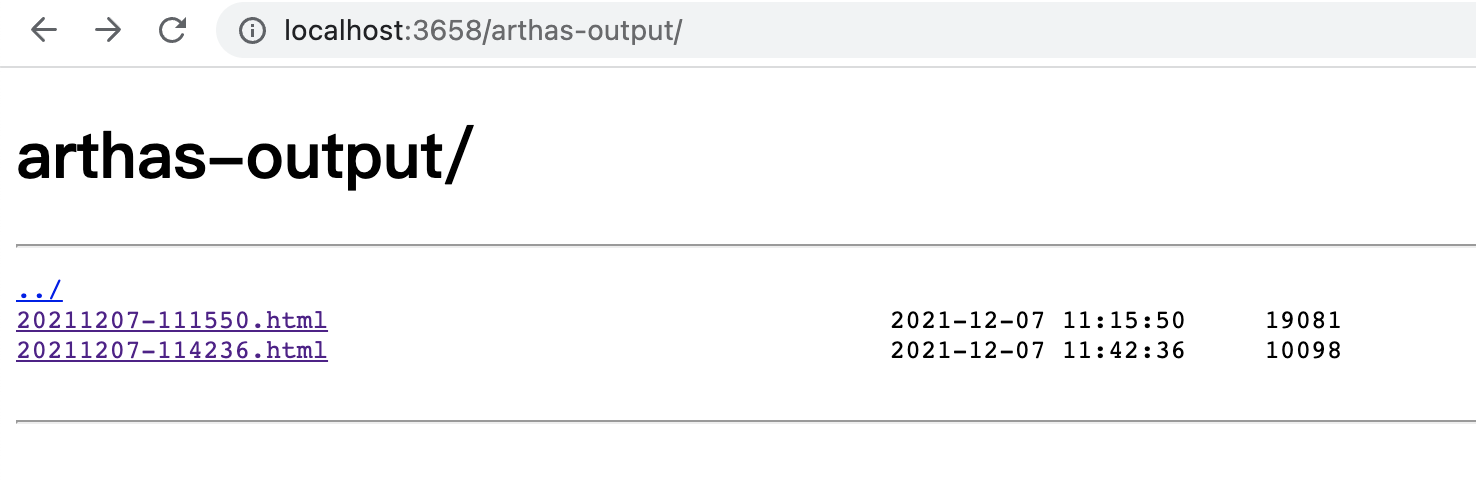
Click to view specific results:
TIP
If using the chrome browser, may need to be refreshed multiple times.
Profiler supported events
Under different platforms and different OSs, the supported events are different. For example, under macos:
$ profiler list
Basic events:
  cpu
  alloc
  lock
  wall
  itimer
Under linux
$ profiler list
Basic events:
  cpu
  alloc
  lock
  wall
  itimer
Java method calls:
  ClassName.methodName
Perf events:
  page-faults
  context-switches
  cycles
  instructions
  cache-references
  cache-misses
  branch-instructions
  branch-misses
  bus-cycles
  L1-dcache-load-misses
  LLC-load-misses
  dTLB-load-misses
  rNNN
  pmu/event-descriptor/
  mem:breakpoint
  trace:tracepoint
  kprobe:func
  uprobe:path
If you encounter the permissions/configuration issues of the OS itself and then missing some events, you can refer to the async-profiler documentation.
You can use the --event parameter to specify the event to sample, for example, alloc event means heap memory allocation profiling:
$ profiler start --event alloc
Resume sampling
$ profiler resume
Started [cpu] profiling
The difference between start and resume is: start will clean existing result of last profiling before starting, resume will retain the existing result and add result of this time to it.
You can verify the number of samples by executing profiler getSamples.
Dump action
$ profiler dump
OK
The dump action saves profiling result to default file or specified file, but profiling will continue. That means if you start profiling and dump after 5 seconds, then dump after 2 seconds again, you will get 2 result files, the first one contains profiling result of 0~5 seconds and the second one contains that of 0~7 seconds.
Use execute action to execute complex commands
For example, start sampling:
profiler execute 'start,framebuf=5000000'
Stop sampling and save to the specified file:
profiler execute 'stop,file=/tmp/result.html'
Specific format reference: arguments.cpp
View all supported actions
$ profiler actions
Supported Actions: [resume, dumpCollapsed, getSamples, start, list, version, execute, meminfo, stop, load, dumpFlat, dump, actions, dumpTraces, status]
View version
$ profiler version
Async-profiler 2.9 built on May  8 2023
Copyright 2016-2021 Andrei Pangin
Configure framebuf option
TIP
you encounter [frame_buffer_overflow] in the generated result, you need to increase the framebuf (the default value is 1'000'000), which can be configured explicitly, such as:
profiler start --framebuf 5000000
Configure include/exclude to filter data
If the application is complex and generates a lot of content, and you want to focus on only part of stack traces, you can filter stack traces by --include/--exclude. --include defines the name pattern that must be present in the stack traces, while --exclude is the pattern that must not occur in any of stack traces in the output.A pattern may begin or end with a star * that denotes any (possibly empty) sequence of characters. such as
profiler start --include'java/*' --include 'com/demo/*' --exclude'*Unsafe.park*'
Both
--include/--excludesupport being set multiple times, but need to be configured at the end of the command line. You can also use short parameter format-I/-X.
Specify execution time
For example, if you want the profiler to automatically end after 300 seconds, you can specify it with the -d/--duration parameter:
profiler start --duration 300
Generate jfr format result
Note that jfr only supports configuration at
start. If it is specified atstop, it will not take effect.
profiler start --file /tmp/test.jfr
profiler start -o jfr
The file parameter supports some variables:
- Timestamp:
--file /tmp/test-%t.jfr - Process ID:
--file /tmp/test-%p.jfr
The generated results can be viewed with tools that support the jfr format. such as:
- JDK Mission Control: https://github.com/openjdk/jmc
- JProfiler: https://github.com/alibaba/arthas/issues/1416
Control details in result
The -s parameter will use simple name instead of Fully qualified name, e.g. MathGame.main instead of demo.MathGame.main. The -g parameter will use method signatures instead of method names, e.g. demo.MathGame.main([Ljava/lang/String;)V instead of demo.MathGame.main. There are many parameters related to result format details, you can refer to async-profiler README and async-profiler Github Discussions and other information.
For example, in command below, -s use simple name for Java class, -g show method signatures, -a will annotate Java methods, -l will prepend library names for native method, --title specify a title for flame graph page, --minwidth will skip frames smaller than 15% in flame graph, --reverse will generate stack-reversed FlameGraph / Call tree.
profiler stop -s -g -a -l --title <flametitle> --minwidth 15 --reverse
The 'unknown' in profiler result
- https://github.com/jvm-profiling-tools/async-profiler/discussions/409