profiler
提示
使用async-profiler生成火焰图
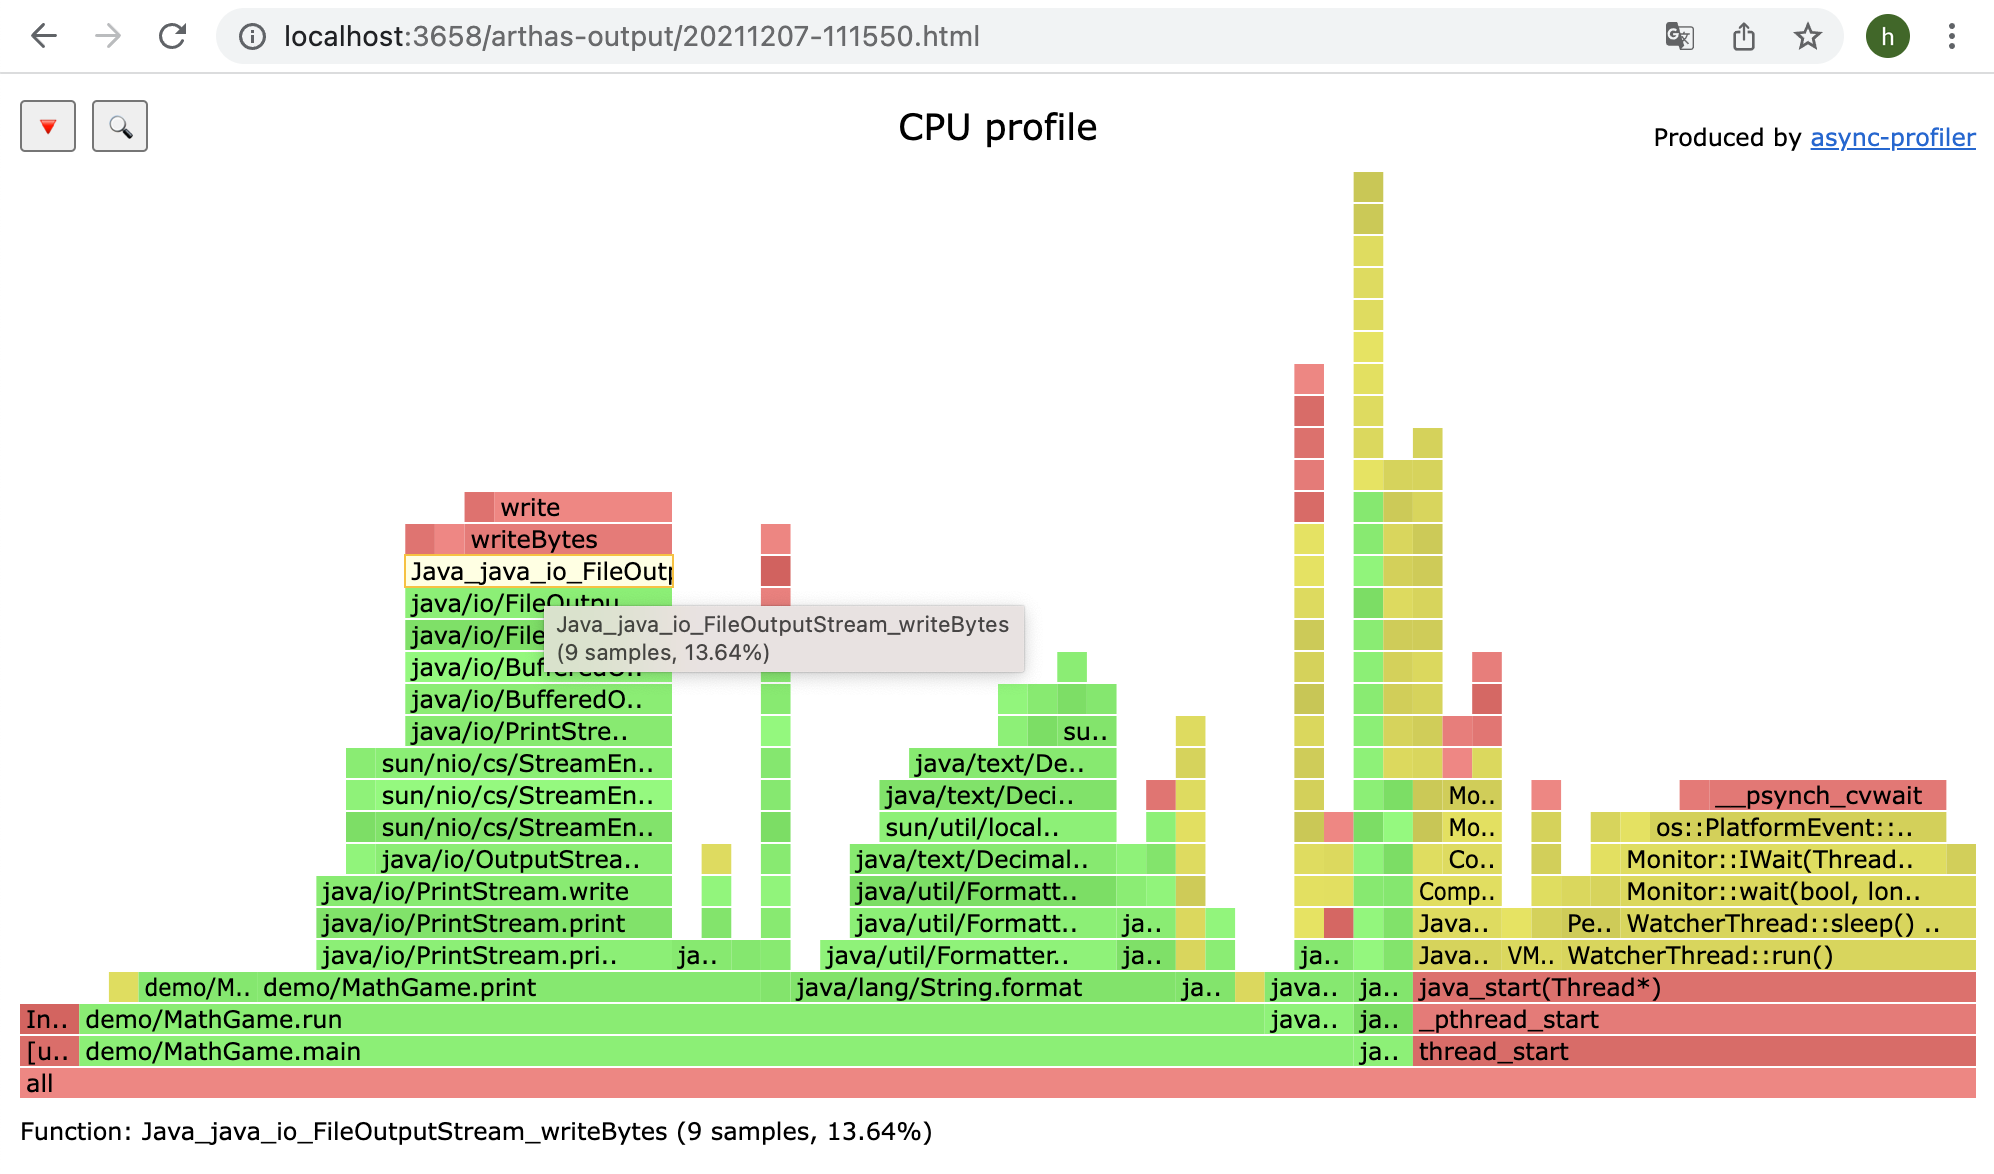
profiler 命令支持生成应用热点的火焰图。本质上是通过不断的采样,然后把收集到的采样结果生成火焰图。
profiler 命令基本运行结构是 profiler action [actionArg]
profiler 命令的格式基本与上游项目 async-profiler 保持一致,详细的使用方式可参考上游项目的 README、Github Disscussions 以及其他文档资料。
参数说明
| 参数名称 | 参数说明 |
|---|---|
| action | 要执行的操作 |
| actionArg | 属性名模式 |
| [i:] | 采样间隔(单位:ns)(默认值:10'000'000,即 10 ms) |
| [f:] | 将输出转储到指定路径 |
| [d:] | 运行评测指定秒 |
| [e:] | 要跟踪哪个事件(cpu, alloc, lock, cache-misses 等),默认是 cpu |
启动 profiler
$ profiler start
Started [cpu] profiling
提示
默认情况下,生成的是 cpu 的火焰图,即 event 为cpu。可以用--event参数指定其他性能分析模式,见下文。
获取已采集的 sample 的数量
$ profiler getSamples
23
查看 profiling 状态
$ profiler status
[cpu] profiling is running for 4 seconds
可以查看当前 profiler 在采样哪种event和采样时间。
查看 profiler 自身的内存占用
$ profiler meminfo
Call trace storage:   10244 KB
      Dictionaries:      72 KB
        Code cache:   12890 KB
------------------------------
             Total:   23206 KB
停止 profiler
生成火焰图格式结果
默认情况下,结果是 Flame Graph 格式的 html 文件,也可以用 -o 或 --format 参数指定其他内容格式,包括 flat、traces、collapsed、flamegraph、tree、jfr。
$ profiler stop --format flamegraph
profiler output file: /tmp/test/arthas-output/20211207-111550.html
OK
在--file参数指定的文件名后缀为 html 或 jfr 时,文件格式可以被推断出来。比如--file /tmp/result.html 将自动生成火焰图。
通过浏览器查看 arthas-output 下面的 profiler 结果
默认情况下,arthas 使用 3658 端口,则可以打开: http://localhost:3658/arthas-output/ 查看到arthas-output目录下面的 profiler 结果:
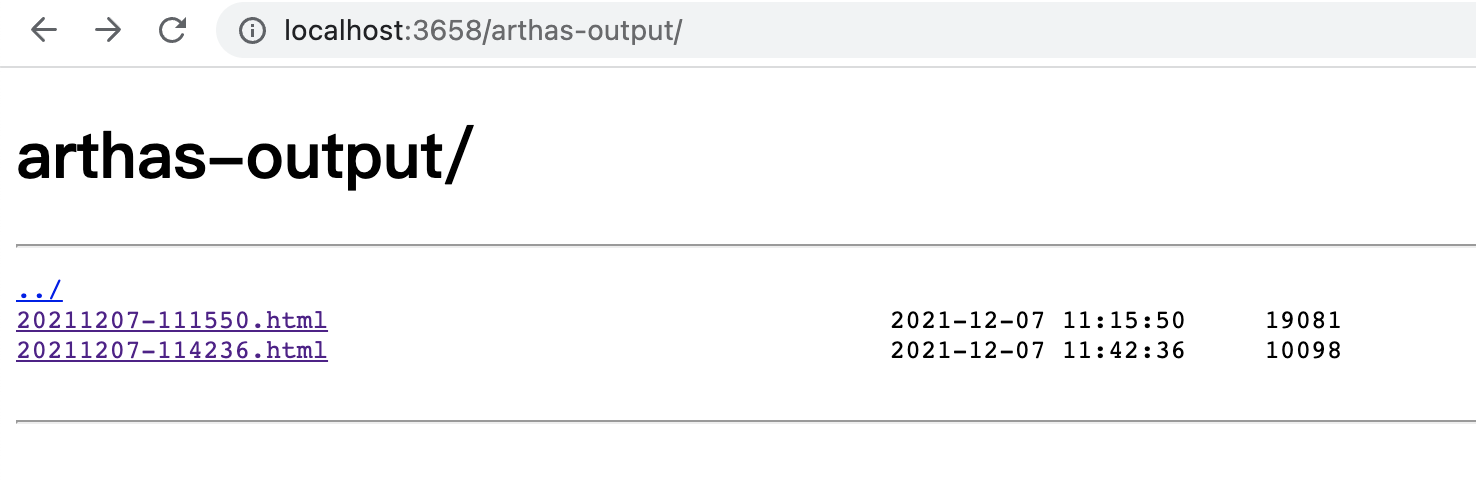
点击可以查看具体的结果:
提示
如果是 chrome 浏览器,可能需要多次刷新。
profiler 支持的 events
在不同的平台,不同的 OS 下面,支持的 events 各有不同。比如在 macos 下面:
$ profiler list
Basic events:
  cpu
  alloc
  lock
  wall
  itimer
在 linux 下面
$ profiler list
Basic events:
  cpu
  alloc
  lock
  wall
  itimer
Java method calls:
  ClassName.methodName
Perf events:
  page-faults
  context-switches
  cycles
  instructions
  cache-references
  cache-misses
  branch-instructions
  branch-misses
  bus-cycles
  L1-dcache-load-misses
  LLC-load-misses
  dTLB-load-misses
  rNNN
  pmu/event-descriptor/
  mem:breakpoint
  trace:tracepoint
  kprobe:func
  uprobe:path
如果遇到 OS 本身的权限/配置问题,然后缺少部分 event,可以参考 async-profiler 的文档。
可以用--event参数指定要采样的事件,比如 alloc 表示分析内存分配情况:
$ profiler start --event alloc
恢复采样
$ profiler resume
Started [cpu] profiling
start和resume的区别是:start会清除已有的分析结果重新开始,resume则会保留已有的结果,将新的分析结果附加到已有结果中。
通过执行profiler getSamples可以查看 samples 的数量来验证。
Dump 分析结果
$ profiler dump
OK
dump action 将性能分析的结果保存到默认文件或指定的文件中,但 profiling 过程不会停止。例如,如果使用 start action 启动 profiling,5 秒后执行 dump action,2 秒后再次执行 dump action,将会得到 2 个结果文件,第一个文件包括 0~5 秒的分析结果,第二个文件包括 0~7 秒的分析结果。
使用execute来执行复杂的命令
比如开始采样:
profiler execute 'start,framebuf=5000000'
停止采样,并保存到指定文件里:
profiler execute 'stop,file=/tmp/result.html'
具体的格式参考: arguments.cpp
查看所有支持的 action
$ profiler actions
Supported Actions: [resume, dumpCollapsed, getSamples, start, list, version, execute, meminfo, stop, load, dumpFlat, dump, actions, dumpTraces, status]
查看版本
$ profiler version
Async-profiler 2.9 built on May  8 2023
Copyright 2016-2021 Andrei Pangin
配置 framebuf 参数
如果遇到生成的火焰图有
[frame_buffer_overflow],则需要增大 framebuf(默认值是 1'000'000),可以显式配置,比如:
profiler start --framebuf 5000000
配置 include/exclude 来过滤数据
如果应用比较复杂,生成的内容很多,想只关注部分 stack traces,可以通过 --include/--exclude 过滤 stack traces,--include 表示定义的匹配表达式必须出现在 stack traces,相反 --exclude 表示定义的匹配表达式一定不会出现在 stack traces。 匹配表达式可以以*开始或者结束,* 表示任何(可能为空)字符序列。 比如
profiler start --include 'java/*' --include 'com/demo/*' --exclude '*Unsafe.park*'
--include/--exclude都支持多次设置,但是需要配置在命令行的最后。也可使用短参数格式-I/-X。
指定执行时间
比如,希望 profiler 执行 300 秒自动结束,可以用 -d/--duration 参数指定:
profiler start --duration 300
生成 jfr 格式结果
注意,jfr 只支持在
start时配置。如果是在stop时指定,则不会生效。
profiler start --file /tmp/test.jfr
profiler start -o jfr
file参数支持一些变量:
- 时间戳:
--file /tmp/test-%t.jfr - 进程 ID:
--file /tmp/test-%p.jfr
生成的结果可以用支持 jfr 格式的工具来查看。比如:
- JDK Mission Control : https://github.com/openjdk/jmc
- JProfiler : https://github.com/alibaba/arthas/issues/1416
控制分析结果的格式
使用 -s 选项将结果中的 Fully qualified name 替换为简单名称,如 demo.MathGame.main 替换为 MathGame.main。使用 -g 选项指定输出方法签名,如 demo.MathGame.main 替换为 demo.MathGame.main([Ljava/lang/String;)V。此外还有许多可调整分析结果格式的选项,可参考 async-profiler 的 README 文档 以及 async-profiler 的 Github Discussions 等材料。
例如,以下命令中,-s 将输出中的类名称指定为简短格式,-g 显示方法的完整签名,-a 标注出 Java 方法,-l 为原生方法增加库名称,--title 为生成火焰图页面指定标题,--minwidth 将过滤火焰图中宽度为 15% 以下的帧,--reverse 将火焰图倒置。
profiler stop -s -g -a -l --title <flametitle> --minwidth 15 --reverse
生成的火焰图里的 unknown
- https://github.com/jvm-profiling-tools/async-profiler/discussions/409